Analyze clicks and bounces in an email campaign
Analyze email clicks
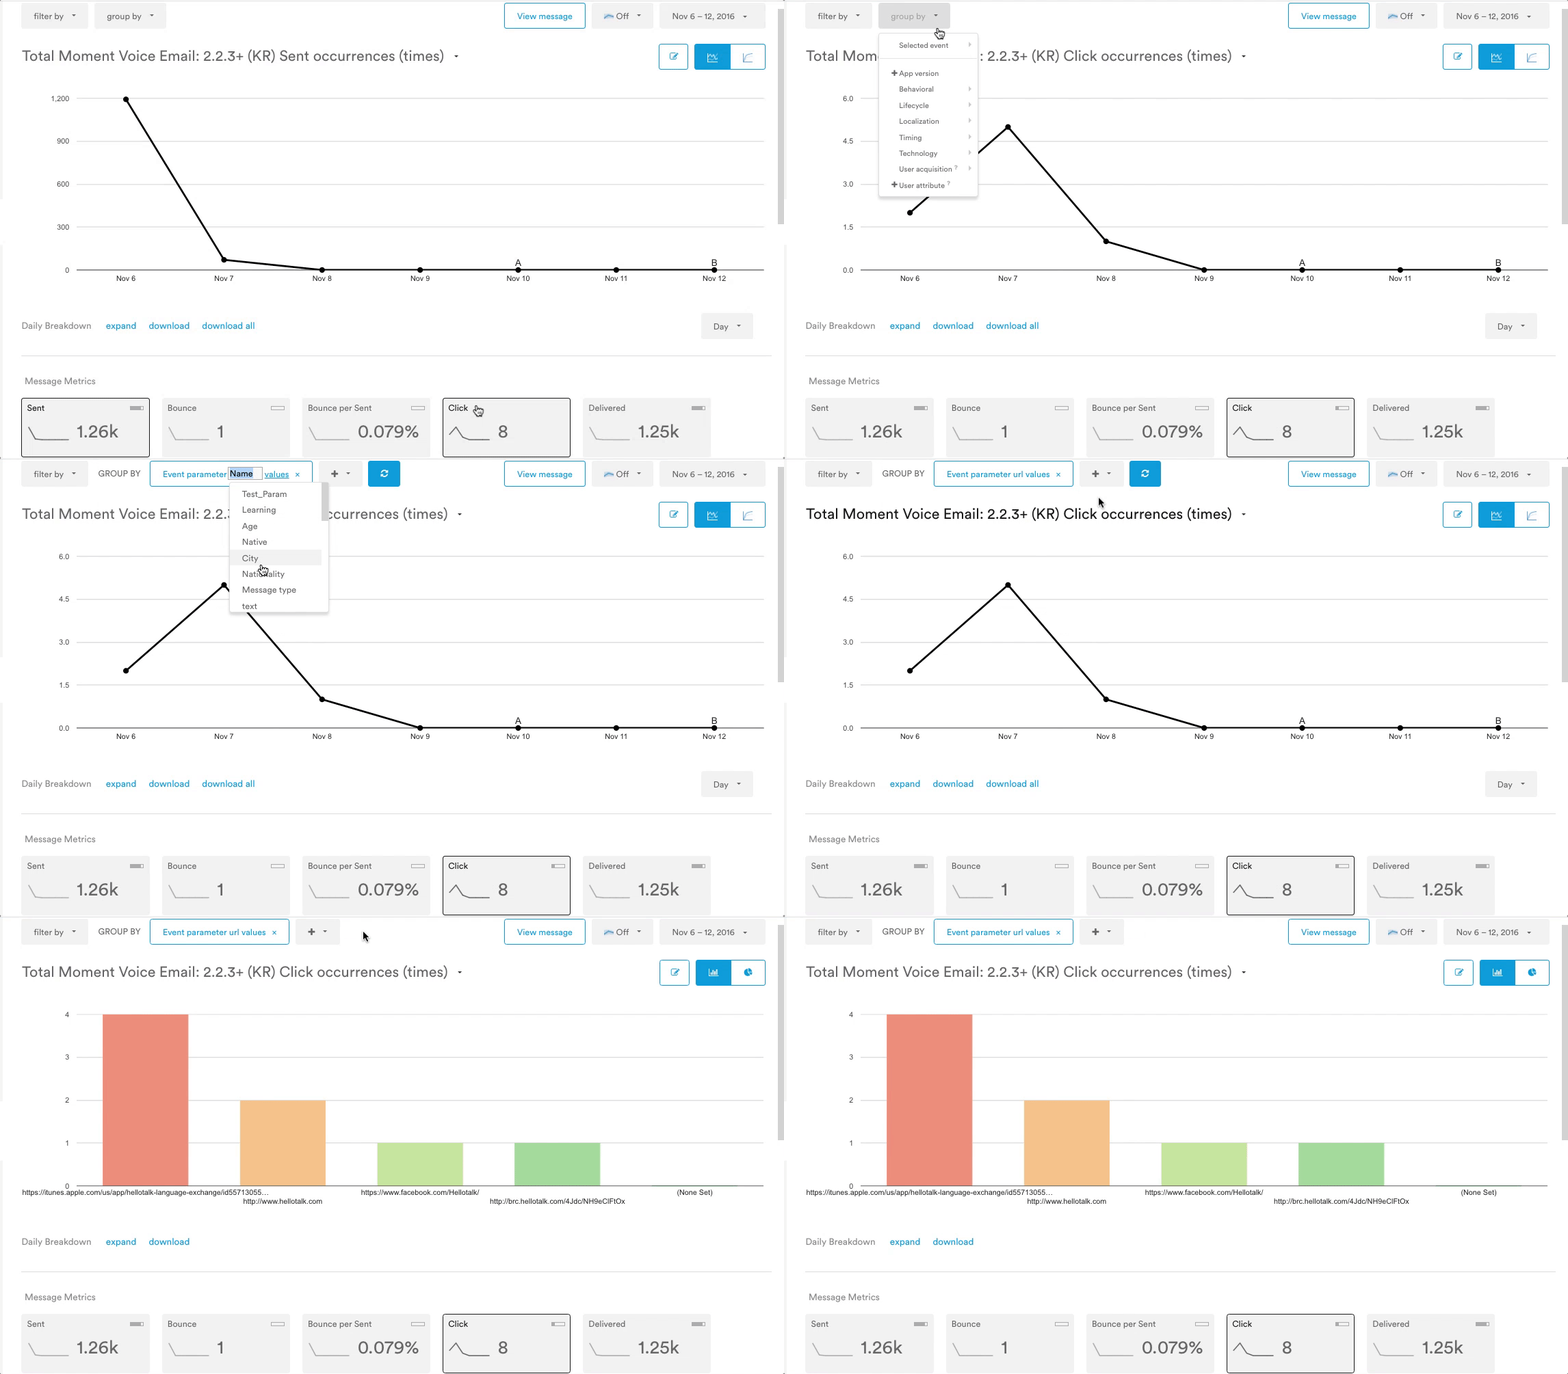
Leanplum automatically tracks a click event for every link in your email. In Analytics, you can do a "group by" report on the click event to see how many users clicked each one of your links.
Click events are tagged with two event parameters:
- index: The location of the link within the email. The first link will be 1, the second 2, etc.
- url: The destination URL of the link.
So, you can group by either of these Event parameters to see how clicks compare.
- In the Analytics dashboard, select the Email from the Messages section
- Select the Click metric tile below the graph
- At the top of the graph, open the Group by dropdown, and choose Selected Event > + Parameter.
- Click Name.
- Select the Click parameter (url or index) from the dropdown.
- Click the Refresh icon.

Note that Leanplum will track clicks for 14 days after an email is finished. Any clicks after day 14 will not count towards your message's Analytics.
Analyze email bounces
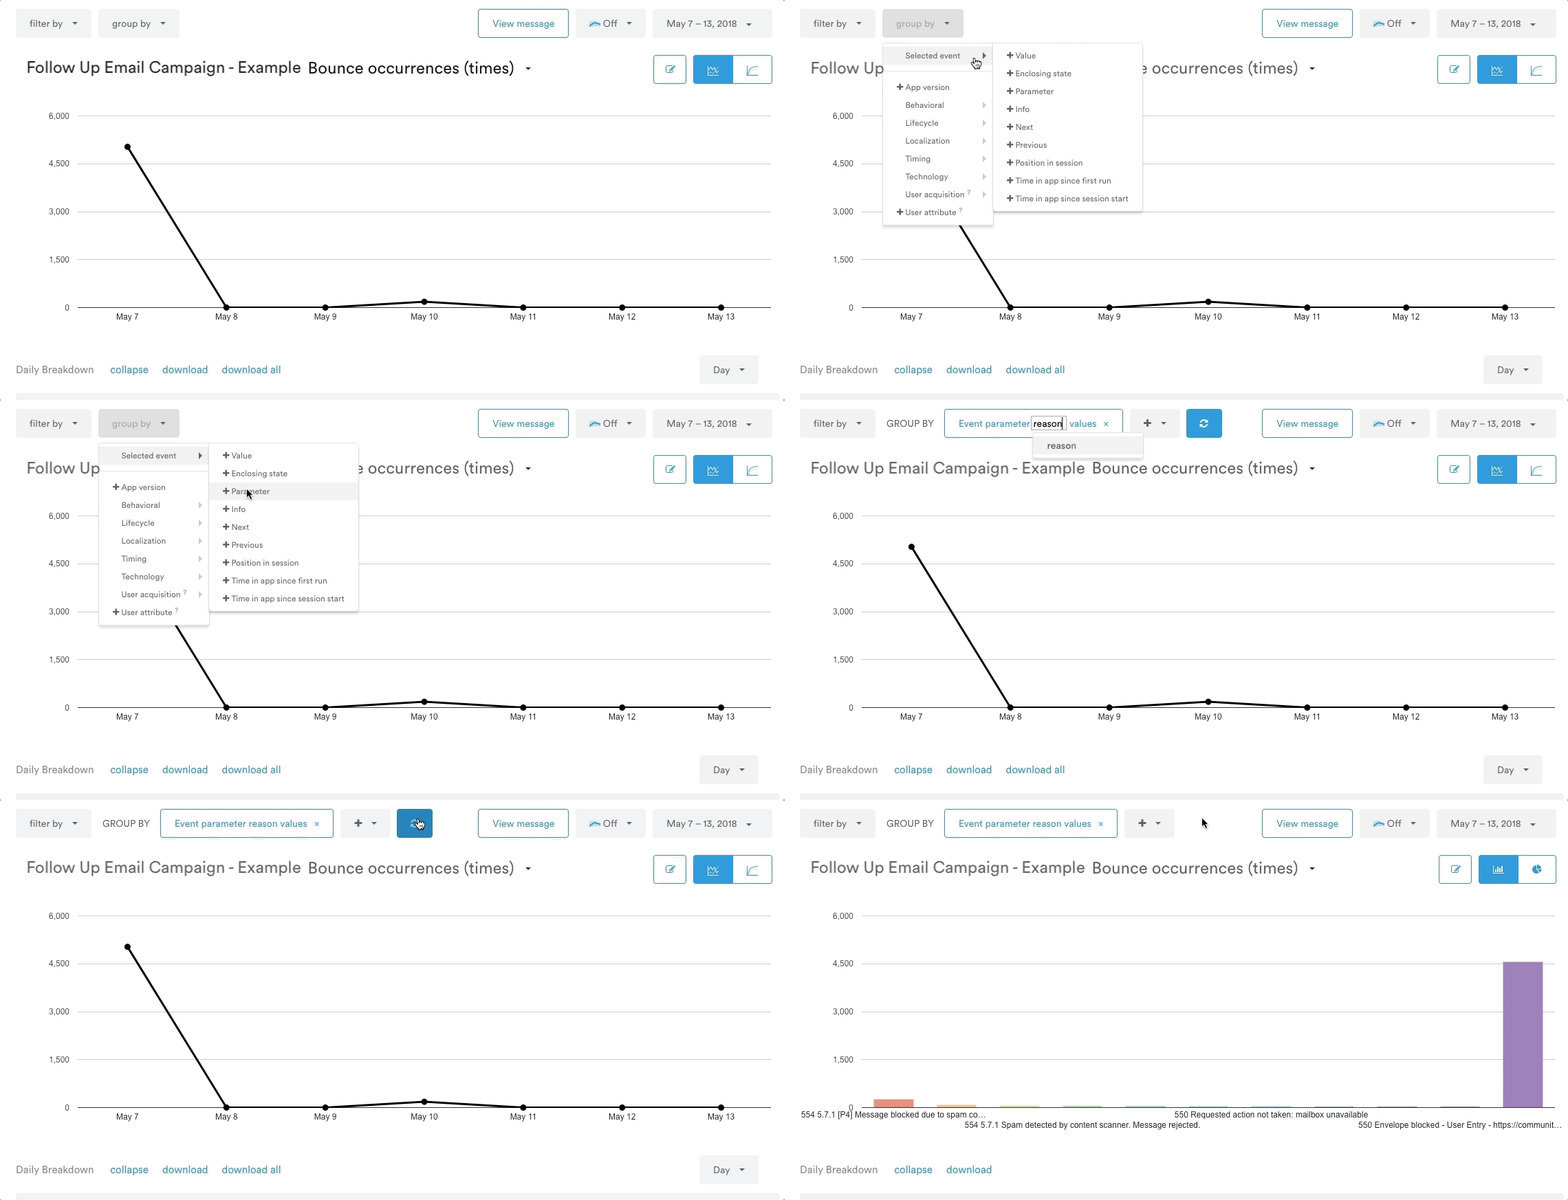
Leanplum automatically tracks Bounce occurrences for your email. In Analytics, here's how you can generate a "group by" report for the Bounce reason to see the raw SMTP responses from inbox providers.
- Go to the Analytics dashboard and select your email from the left sidebar.
- Click the Bounce metric tile below the graph so that the graph displays Bounce occurrences.
- Click the Group by dropdown menu, and choose Selected Event > Parameter
- Type the word "reason." (The parameter is case-sensitive, so make sure "reason" is lowercase).
- Click the Refresh button.

Scroll down below the graph for more details about your results. You can download your results as a CSV file by clicking download from the Daily Breakdown view.
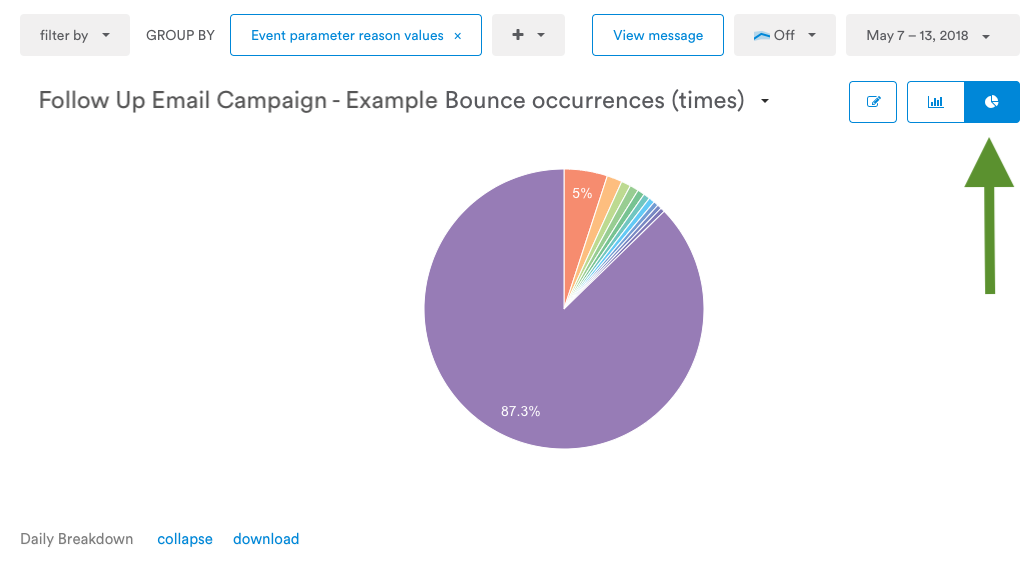
For a pie chart view of your data, select the pie chart view in the upper right.

Updated 5 months ago
